Less Cars, Less Accidents? Covid-19 Tells A Different Story
How connected car data and data intelligence can be used to Predict Risk and Develop Better Transportation Strategies
Like most places under lockdown from the Covid-19 pandemic, the UK experienced significantly less traffic than before the stay-at-home orders. UK trips fell by almost 60% immediately following the lockdown mandated on March 15 compared to January, February, and early March. The anonymized data was collected from approximately 10,000 vehicles across the ALD Automotive fleet in the UK.

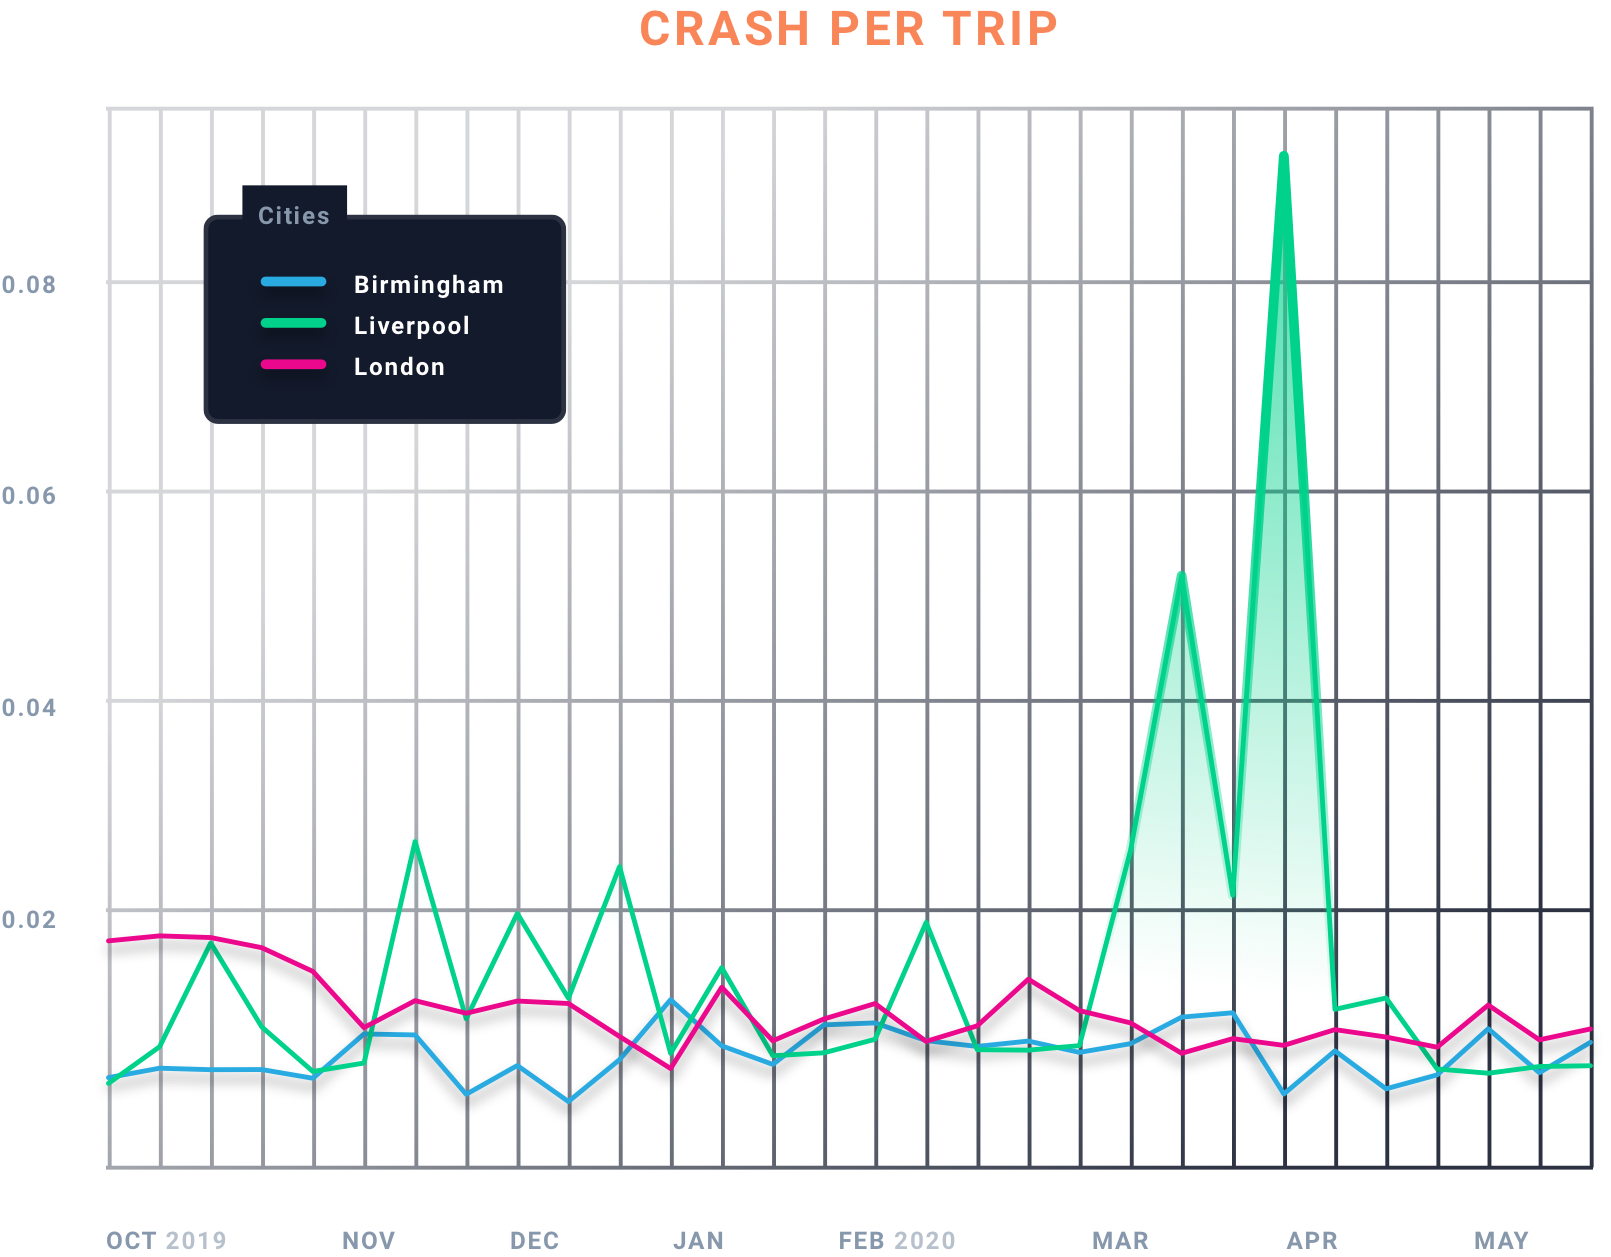
Why were there more accidents in Liverpool on March 11 than any other day leading up to the Covid-19 lockdown? Does this have something to do with the 500% increase in Covid-19 cases reported around the same time?
Is there data that could have predicted this outcome so automakers, leasing and insurance companies, and the people behind the wheel could have taken measures to protect themselves, employees, and their vehicles?
These are the questions that we at ALD Automotive and Vinli want to answer. Understanding risk within the environment and the world in real-time enables automakers, leasing, insurance, and banking companies to tailor solutions for end users on-the-fly. They can provide safer and cheaper means of transportation while incurring less risk.
We are using Vinli’s ERA, a data intelligence platform designed to map real-world data, to help us understand how Covid-19 impacts driving behavior in the UK. With this data, we can develop better transportation strategies.
To better illustrate this, let’s look into the data and observe the driving behavior pointing to the potential for more accidents.
Deep Dive Into Driver Behavior Data
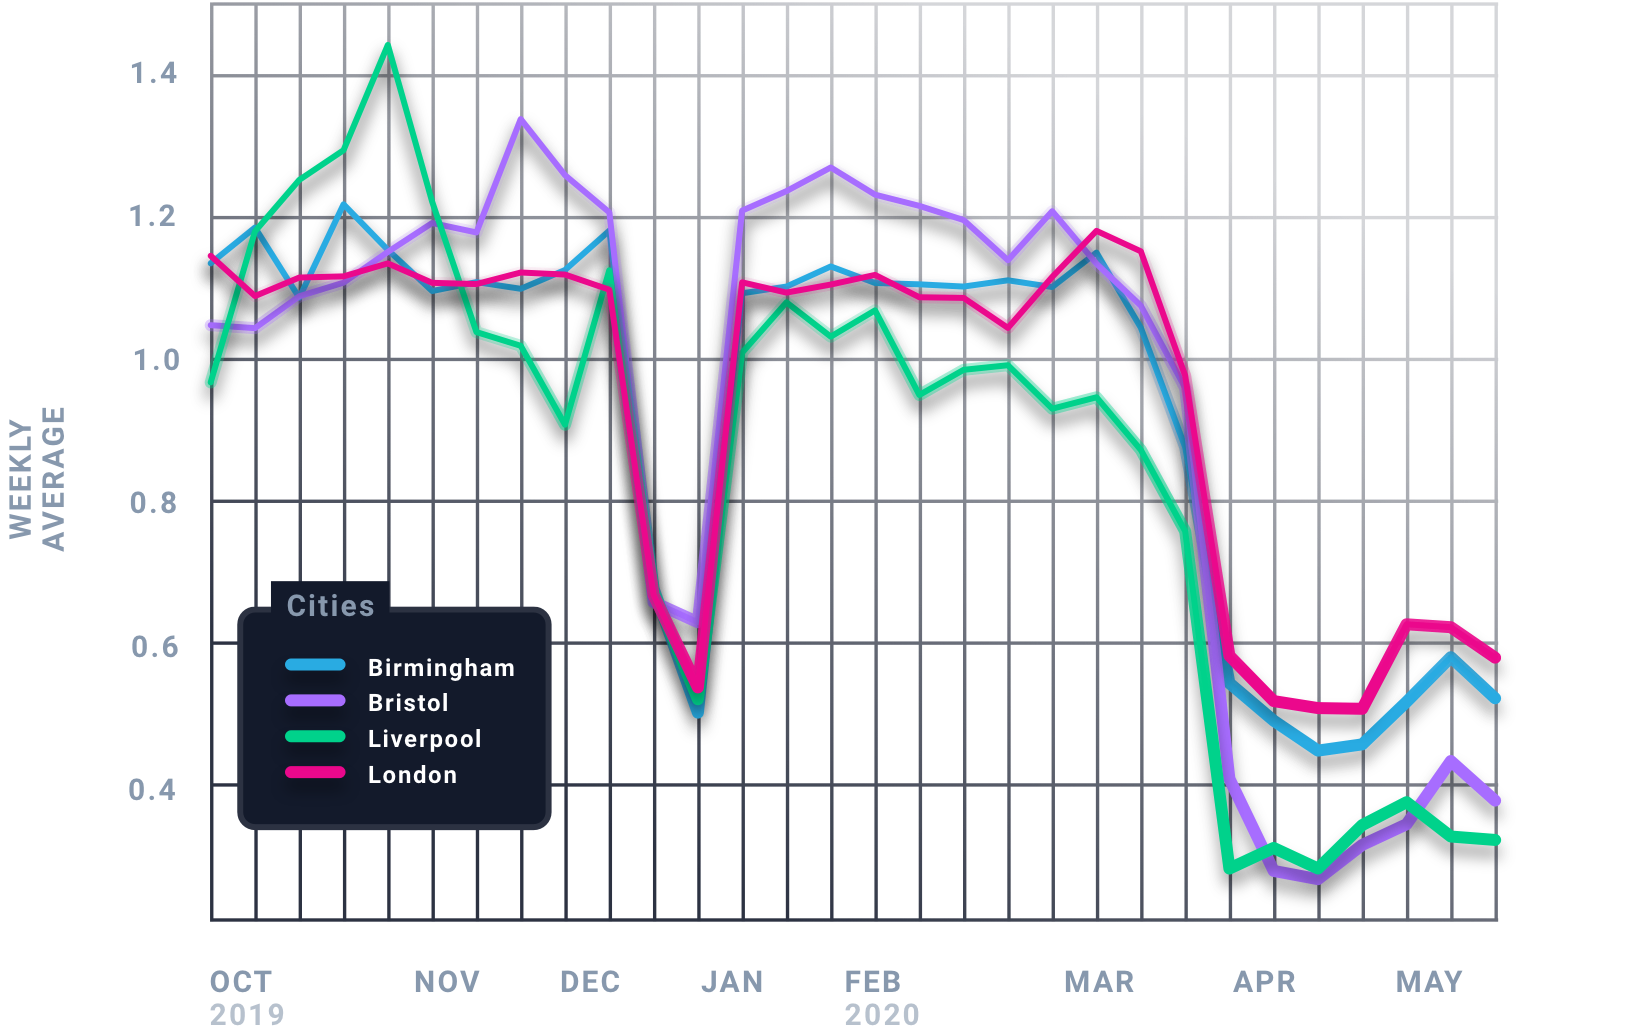
We are collecting data from 10,000 vehicles driven inside the UK. The first thing we noticed was a drop in driving activity after the Covid-19 lockdown.
Data usually stops with showing less trips and events but, with ERA, we can easily follow the data breadcrumbs, so to speak, to look deeper into contextual data. This enables us to see anomalies and understand patterns within the data fragmented across cities and regions. What we’re finding defies conventional wisdom, which is why it’s so important to collect and understand this fragmented data.
Notice how in addition to less trips and events, the lockdown impacts driving behavior while in transit.
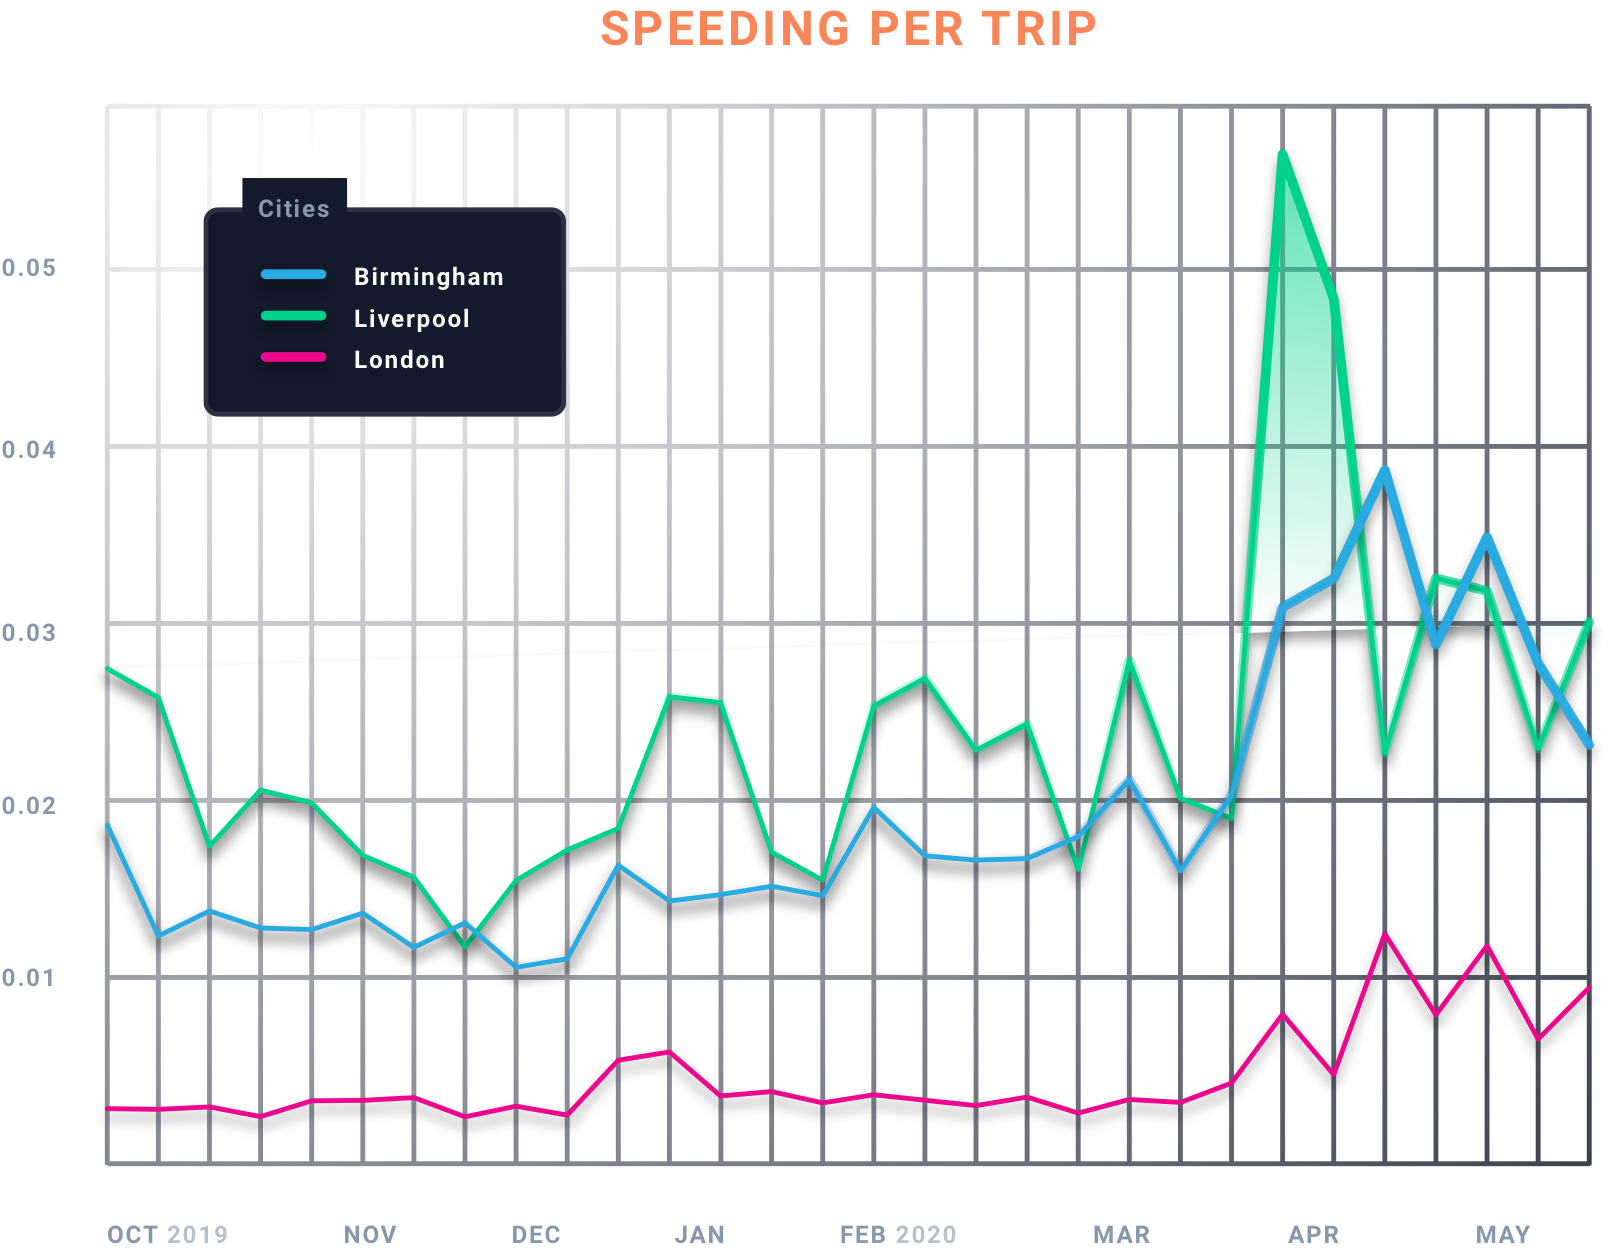
We see a 20% increase in hard braking per trip even when accounting for cities with different infrastructure, such as the distance and number of street lights within an area.
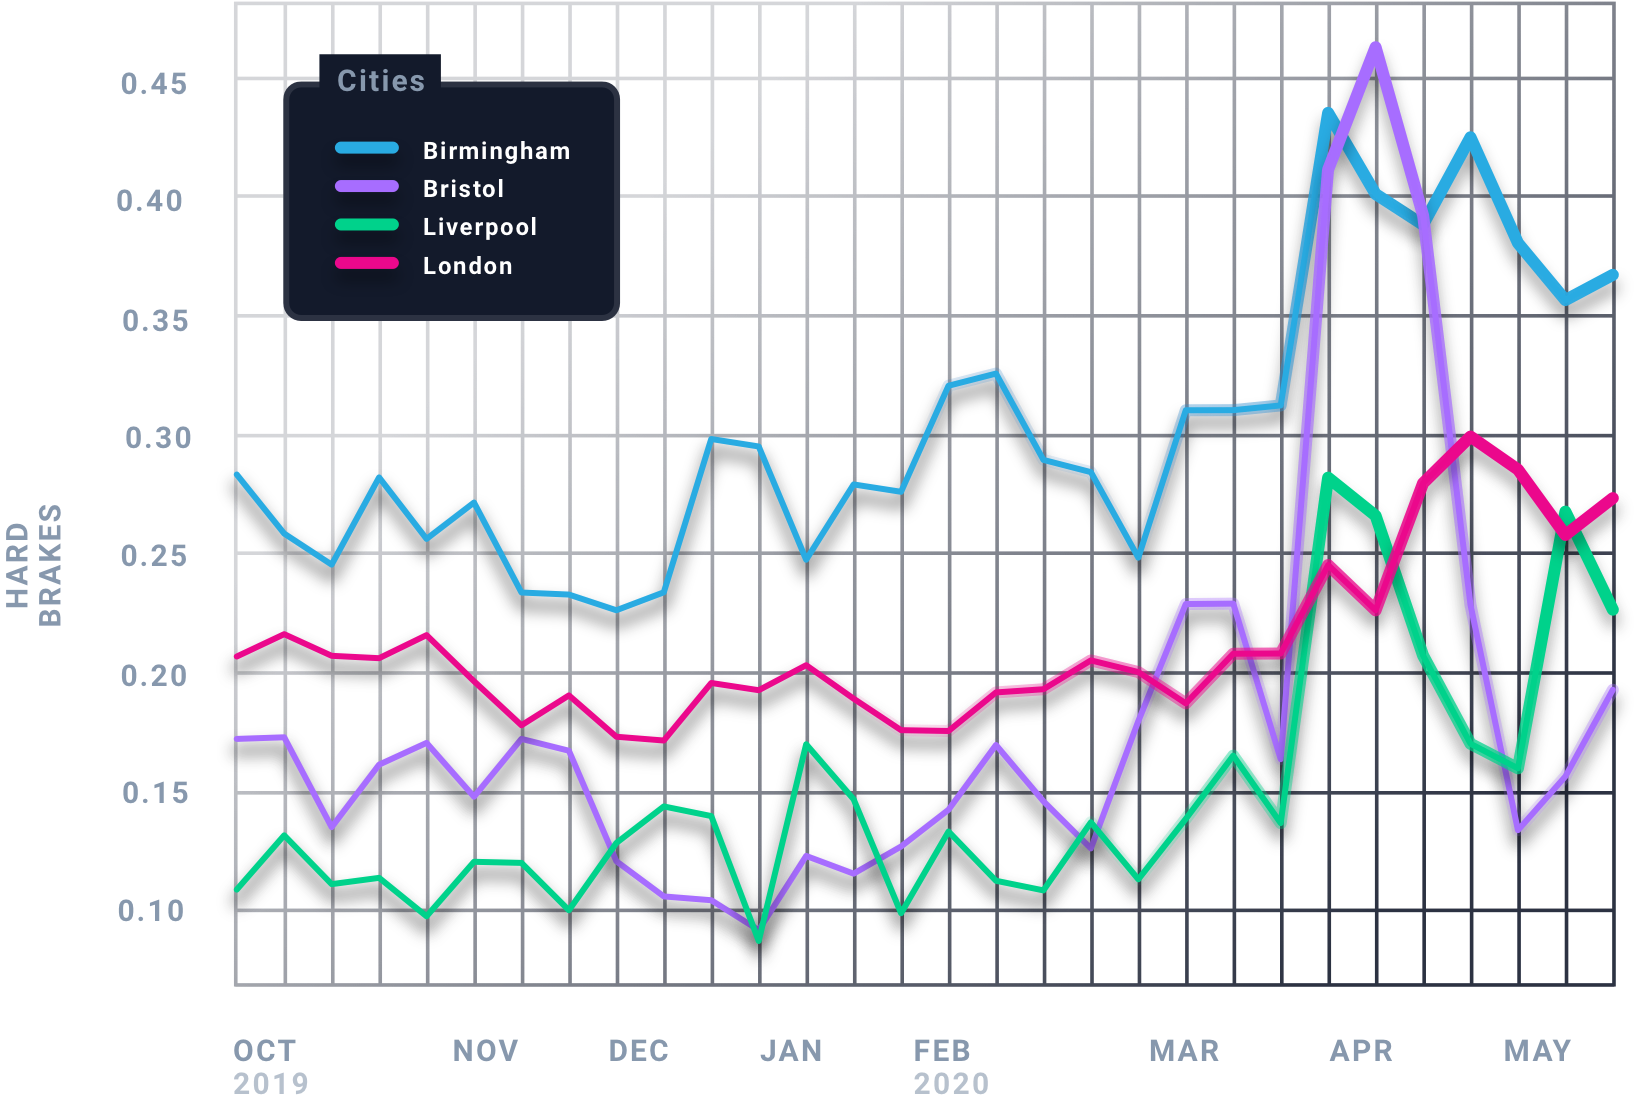
What’s also interesting is the slight decrease in hard acceleration compared to before the lockdown. There is an increase in speeding and crashes yet a decrease in weekly trips, weekly drivers, and average distance. Everything decreased except for risky driving behavior.

This leads us to ask a lot of questions. For example, why the decrease in hard accelerations? Is this because there are less vehicles and people around so drivers are not hard accelerating at stop signs and lights? If so, why do we see an increase in hard brakes? Is this a subconscious reaction to stress around the Covid-19 lockdown?
Less Cars Lead to More Accidents
Less cars on the road should equate to less accidents, right? Why is the data showing a different story?
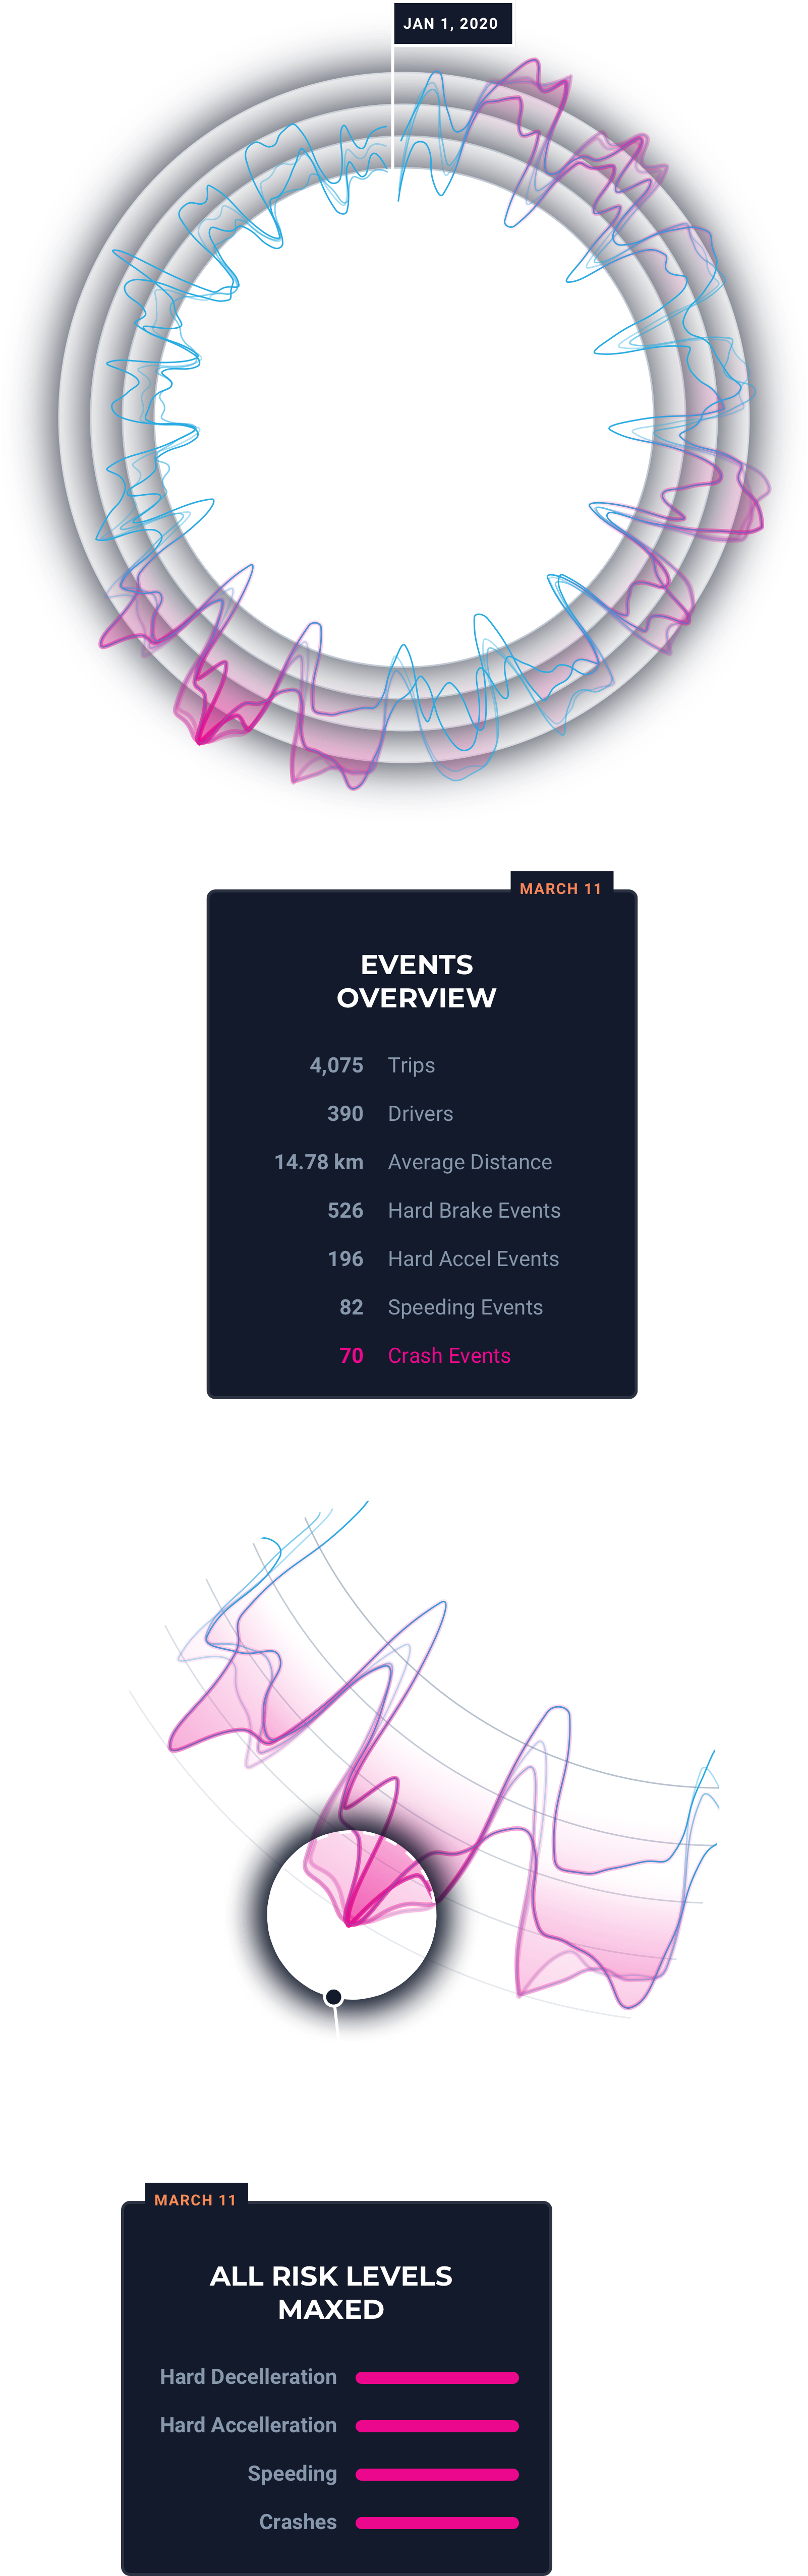
Using ERA’s Fingerprint, we see anomalies to help us understand these patterns.
The circle represents perfect driving behavior, such as following the speed limit. Each graph spiking out of the circle represents a different metric such as hard braking, hard accelerations, and crashes. This fingerprint represents the entire UK driving data sample starting on January 1 and circles clockwise through time.
On March 11…
…right before the mandated lockdown on March 15, is when we start to see some anomalies. We look deeper into that data unit and see a lot of the risk levels are maxed out. There was an increase in hard brakes, hard acceleration, speeding, crashes, and more at that specific peak. What’s going on?
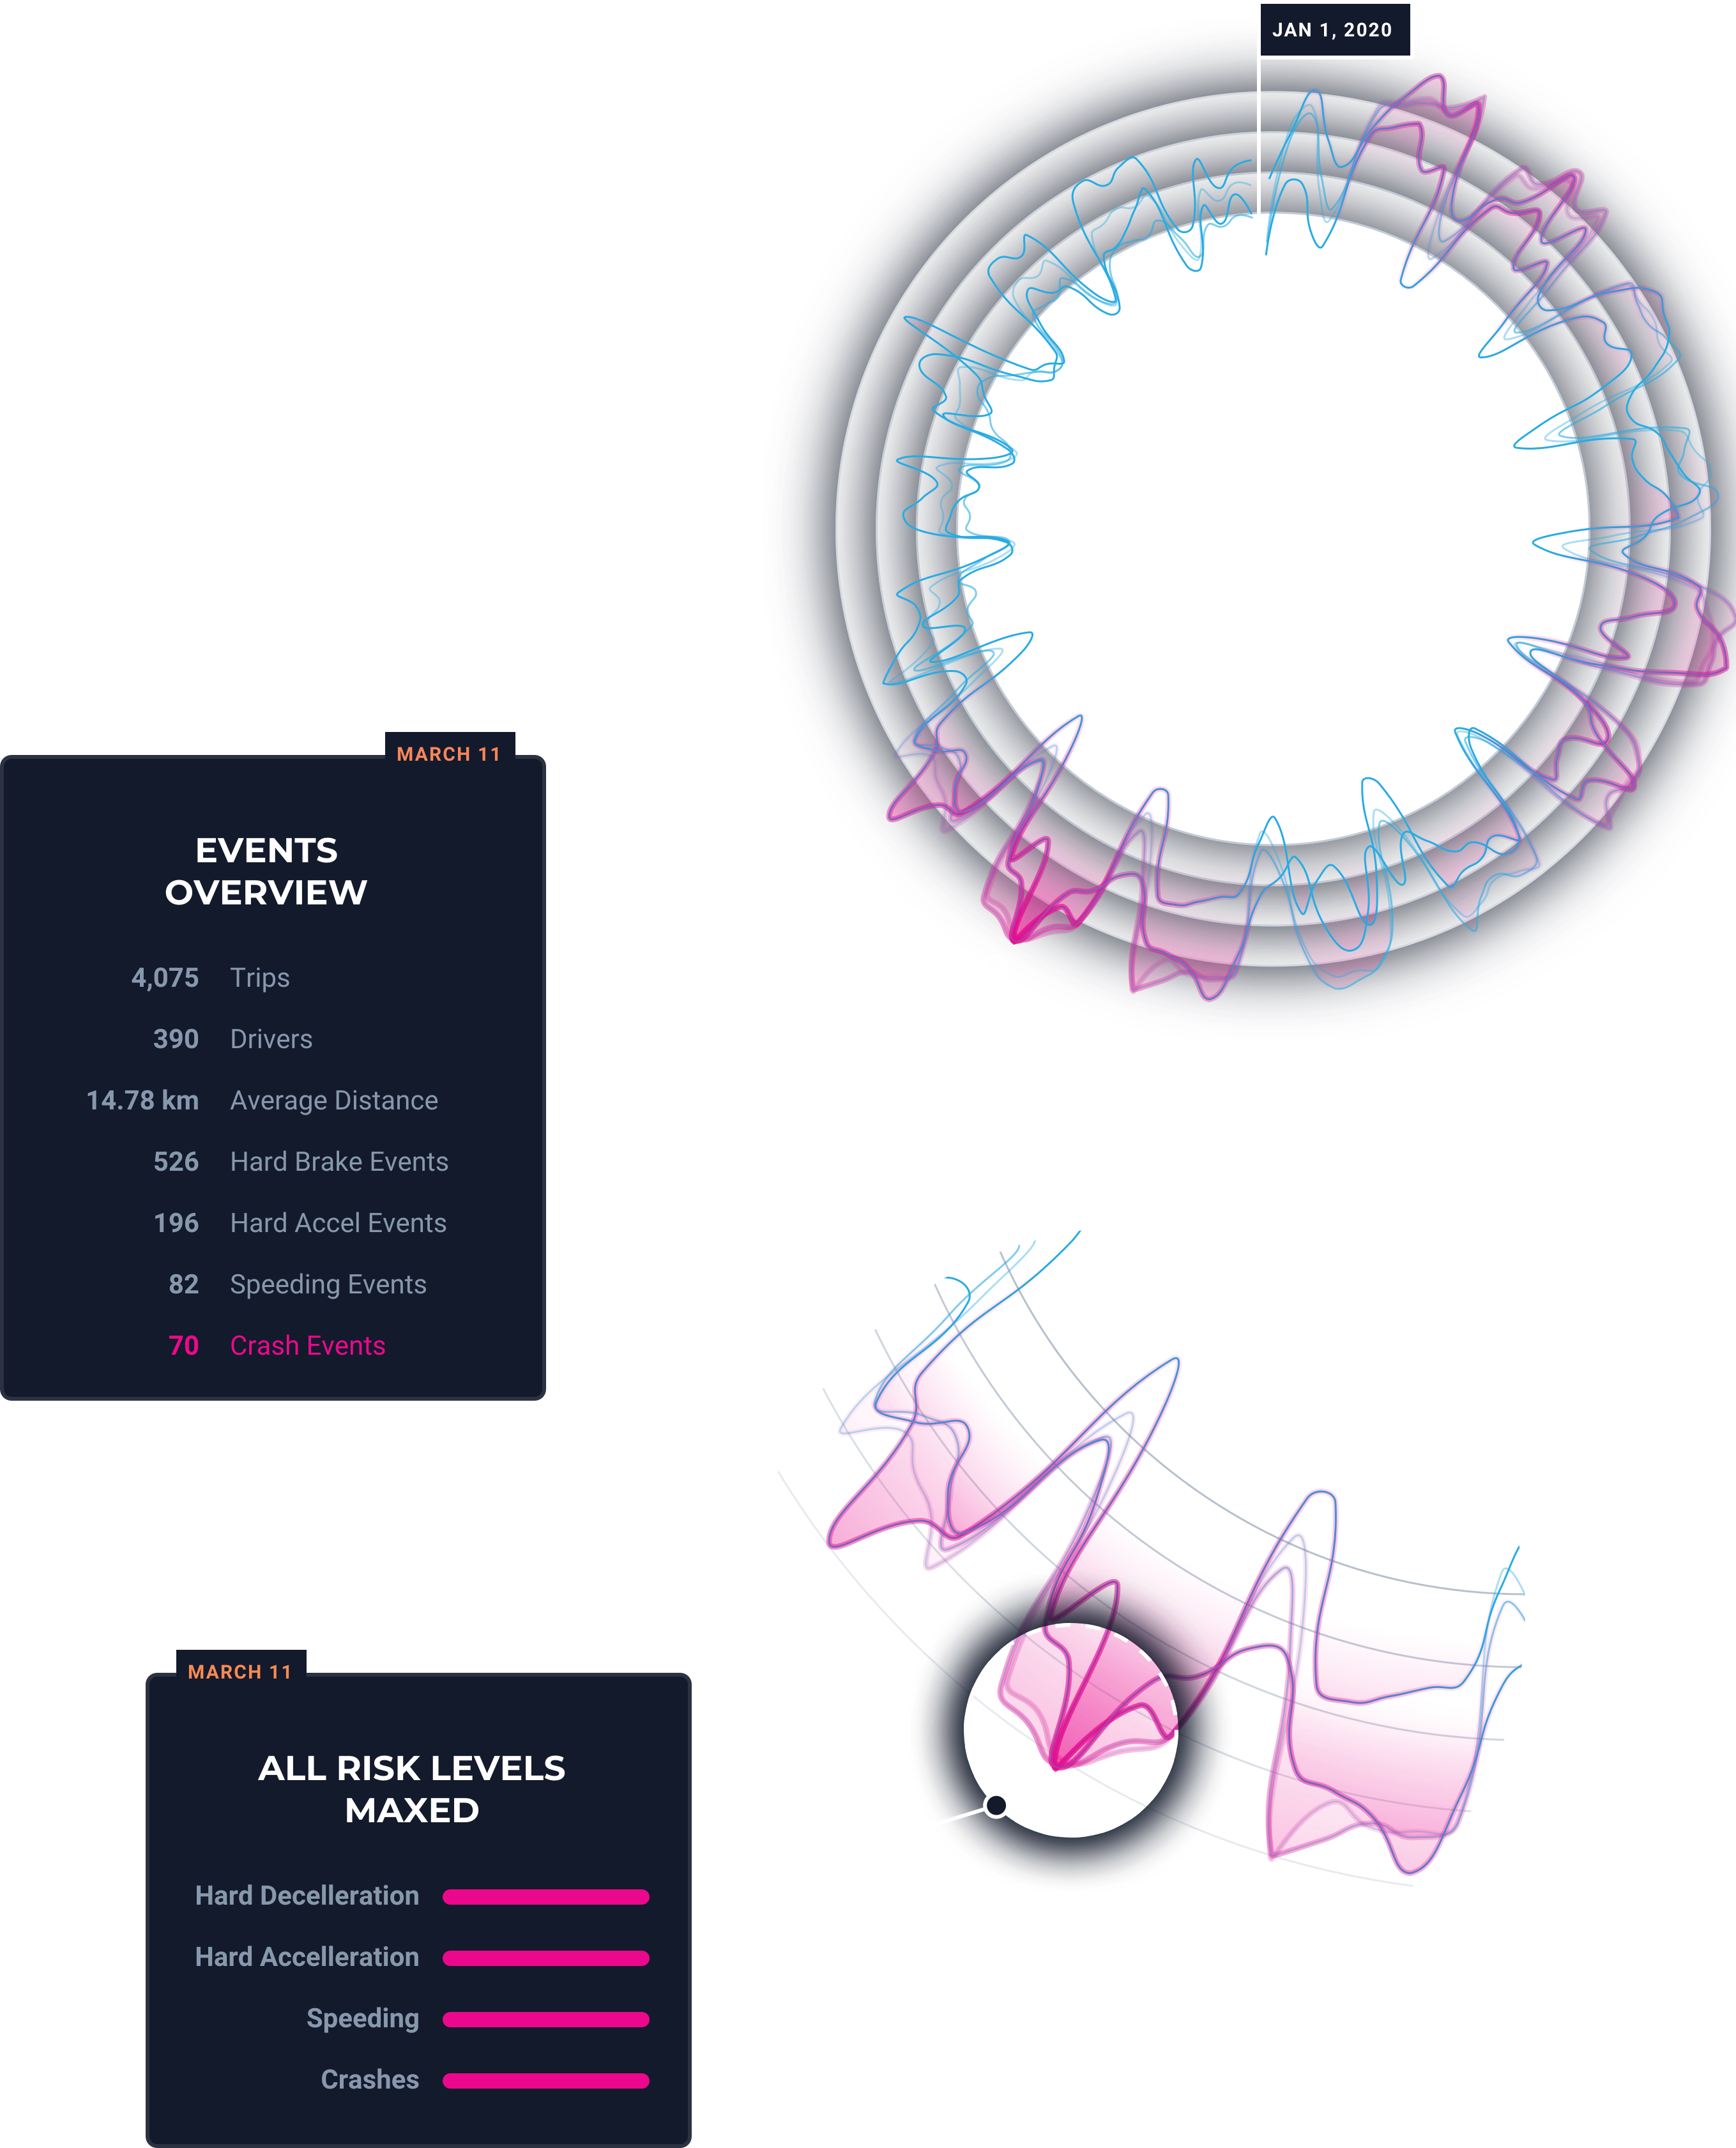
We look at speeding and crashes across the UK.

We see an 18% increase in speeding and a 50% increase in crashes from roughly 10,000 vehicles with the Vinli platform. We look deeper into data per city and see Liverpool is the city with the most activity, specifically with speeding and crashes per trip. What's going on with Liverpool?
Conventional wisdom says that people speeding is the reason for more accidents. We look deeper into the speeding and crash patterns for March 11.
The blue represents speeding and pink represents crashes.
Speeding did not lead to crashes. The speeding happened on the highway between Manchester and Liverpool and crashes happened inside Liverpool. What’s going on?
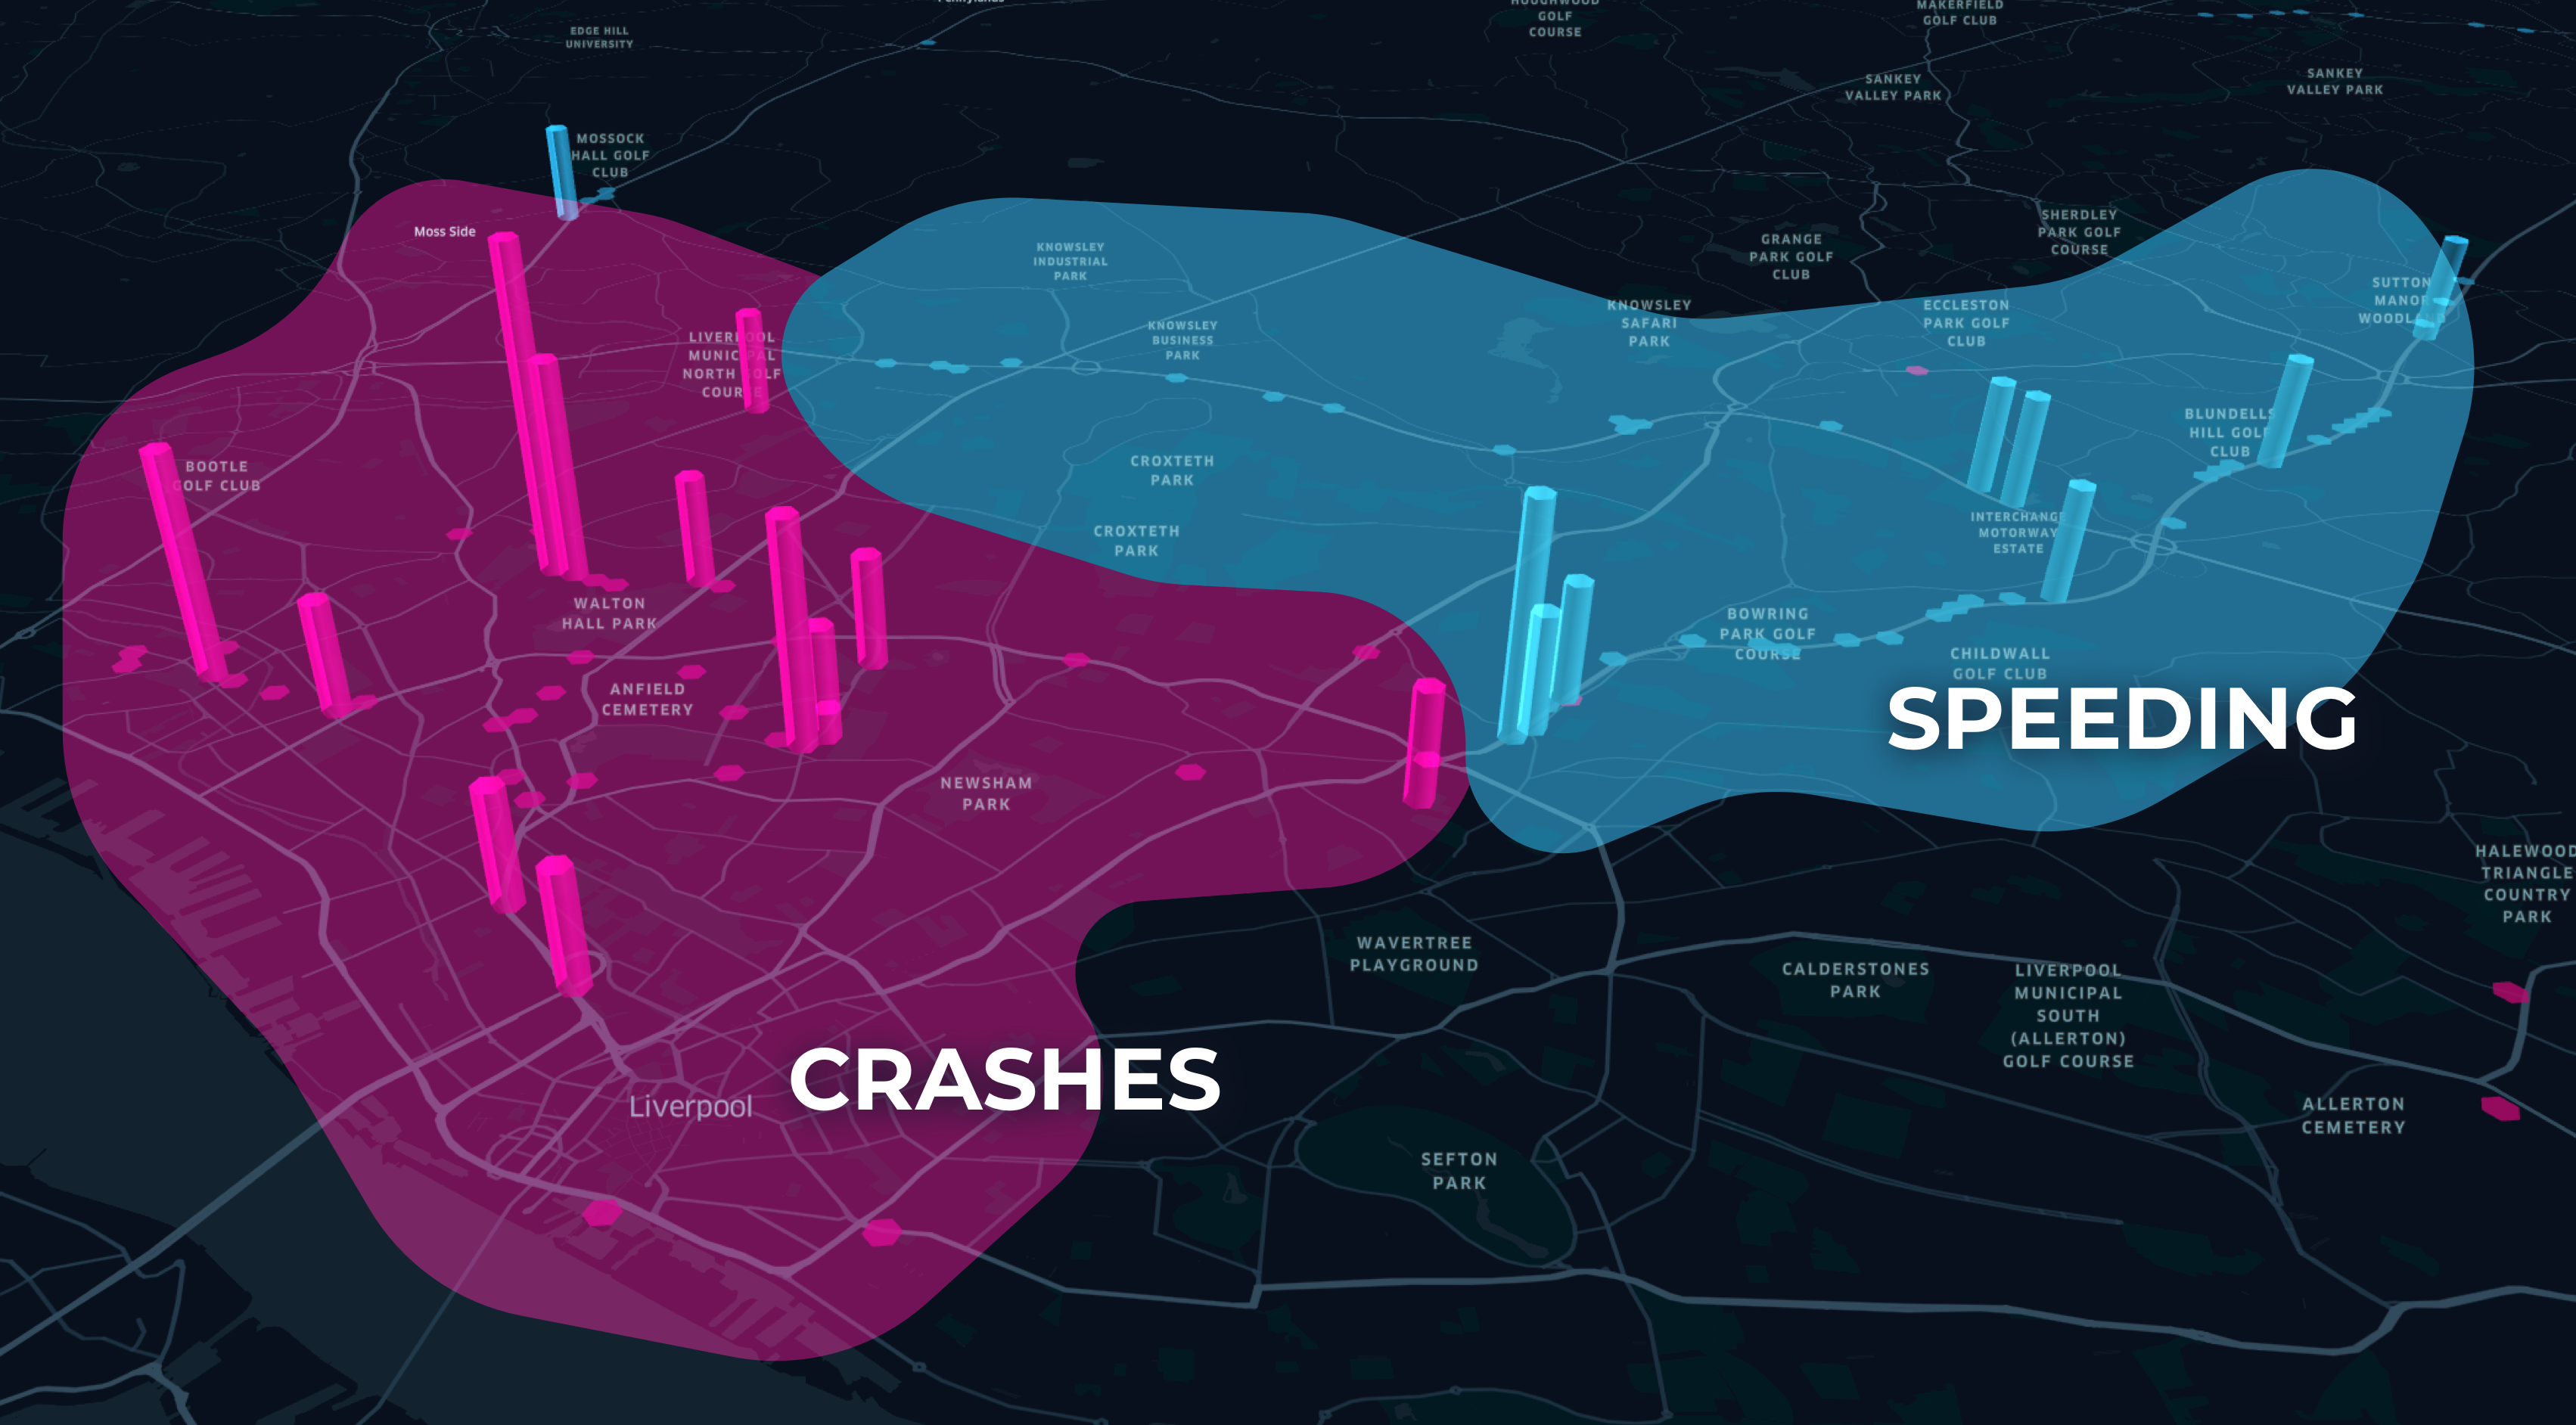
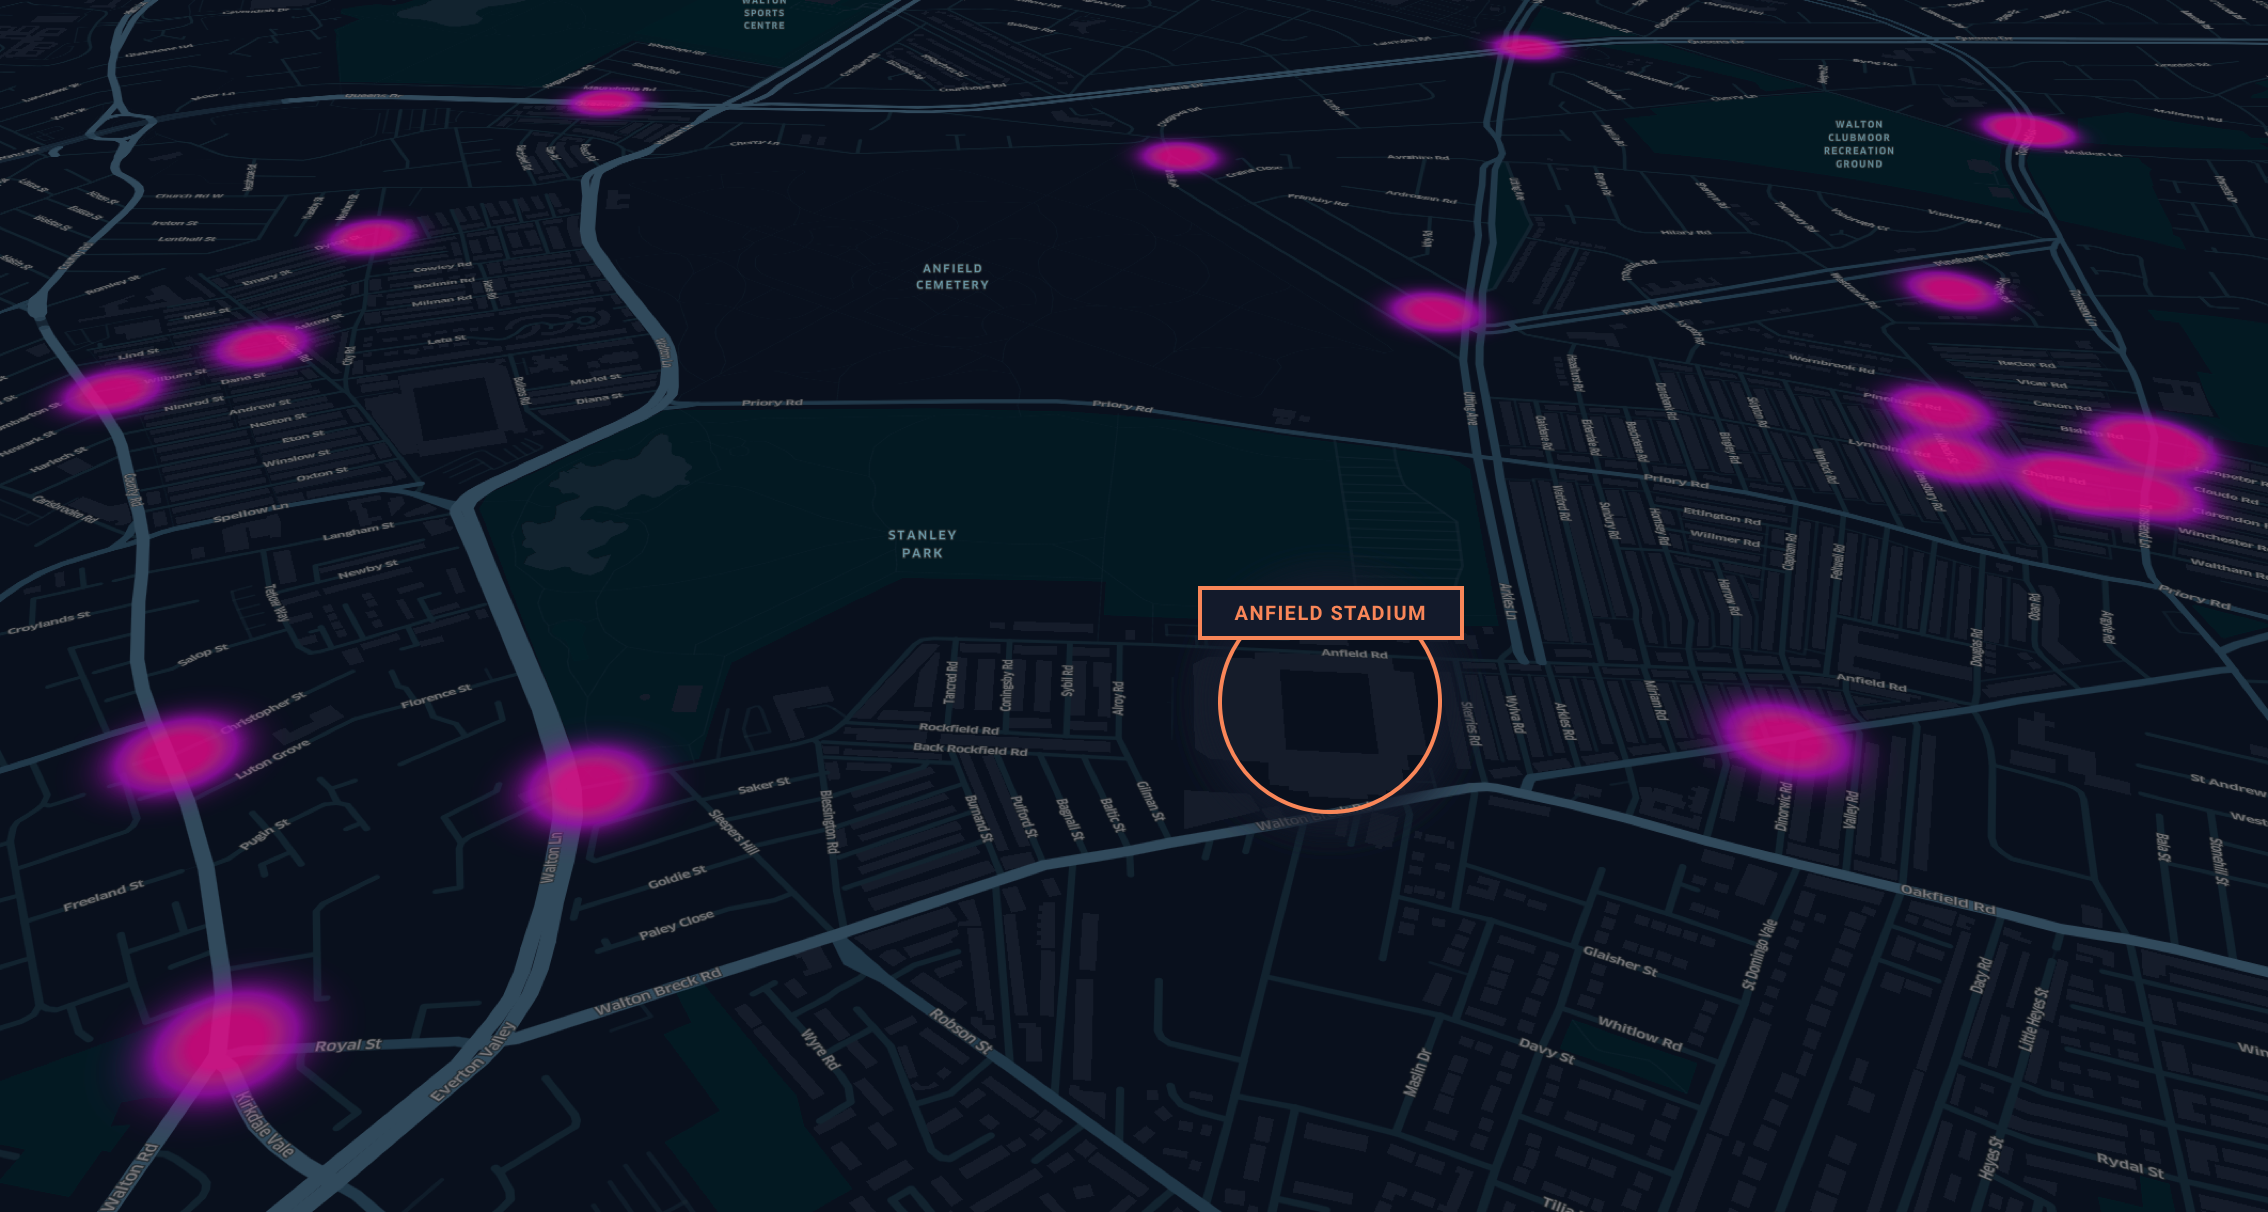
We look at where the crashes happened. See that hotspot?
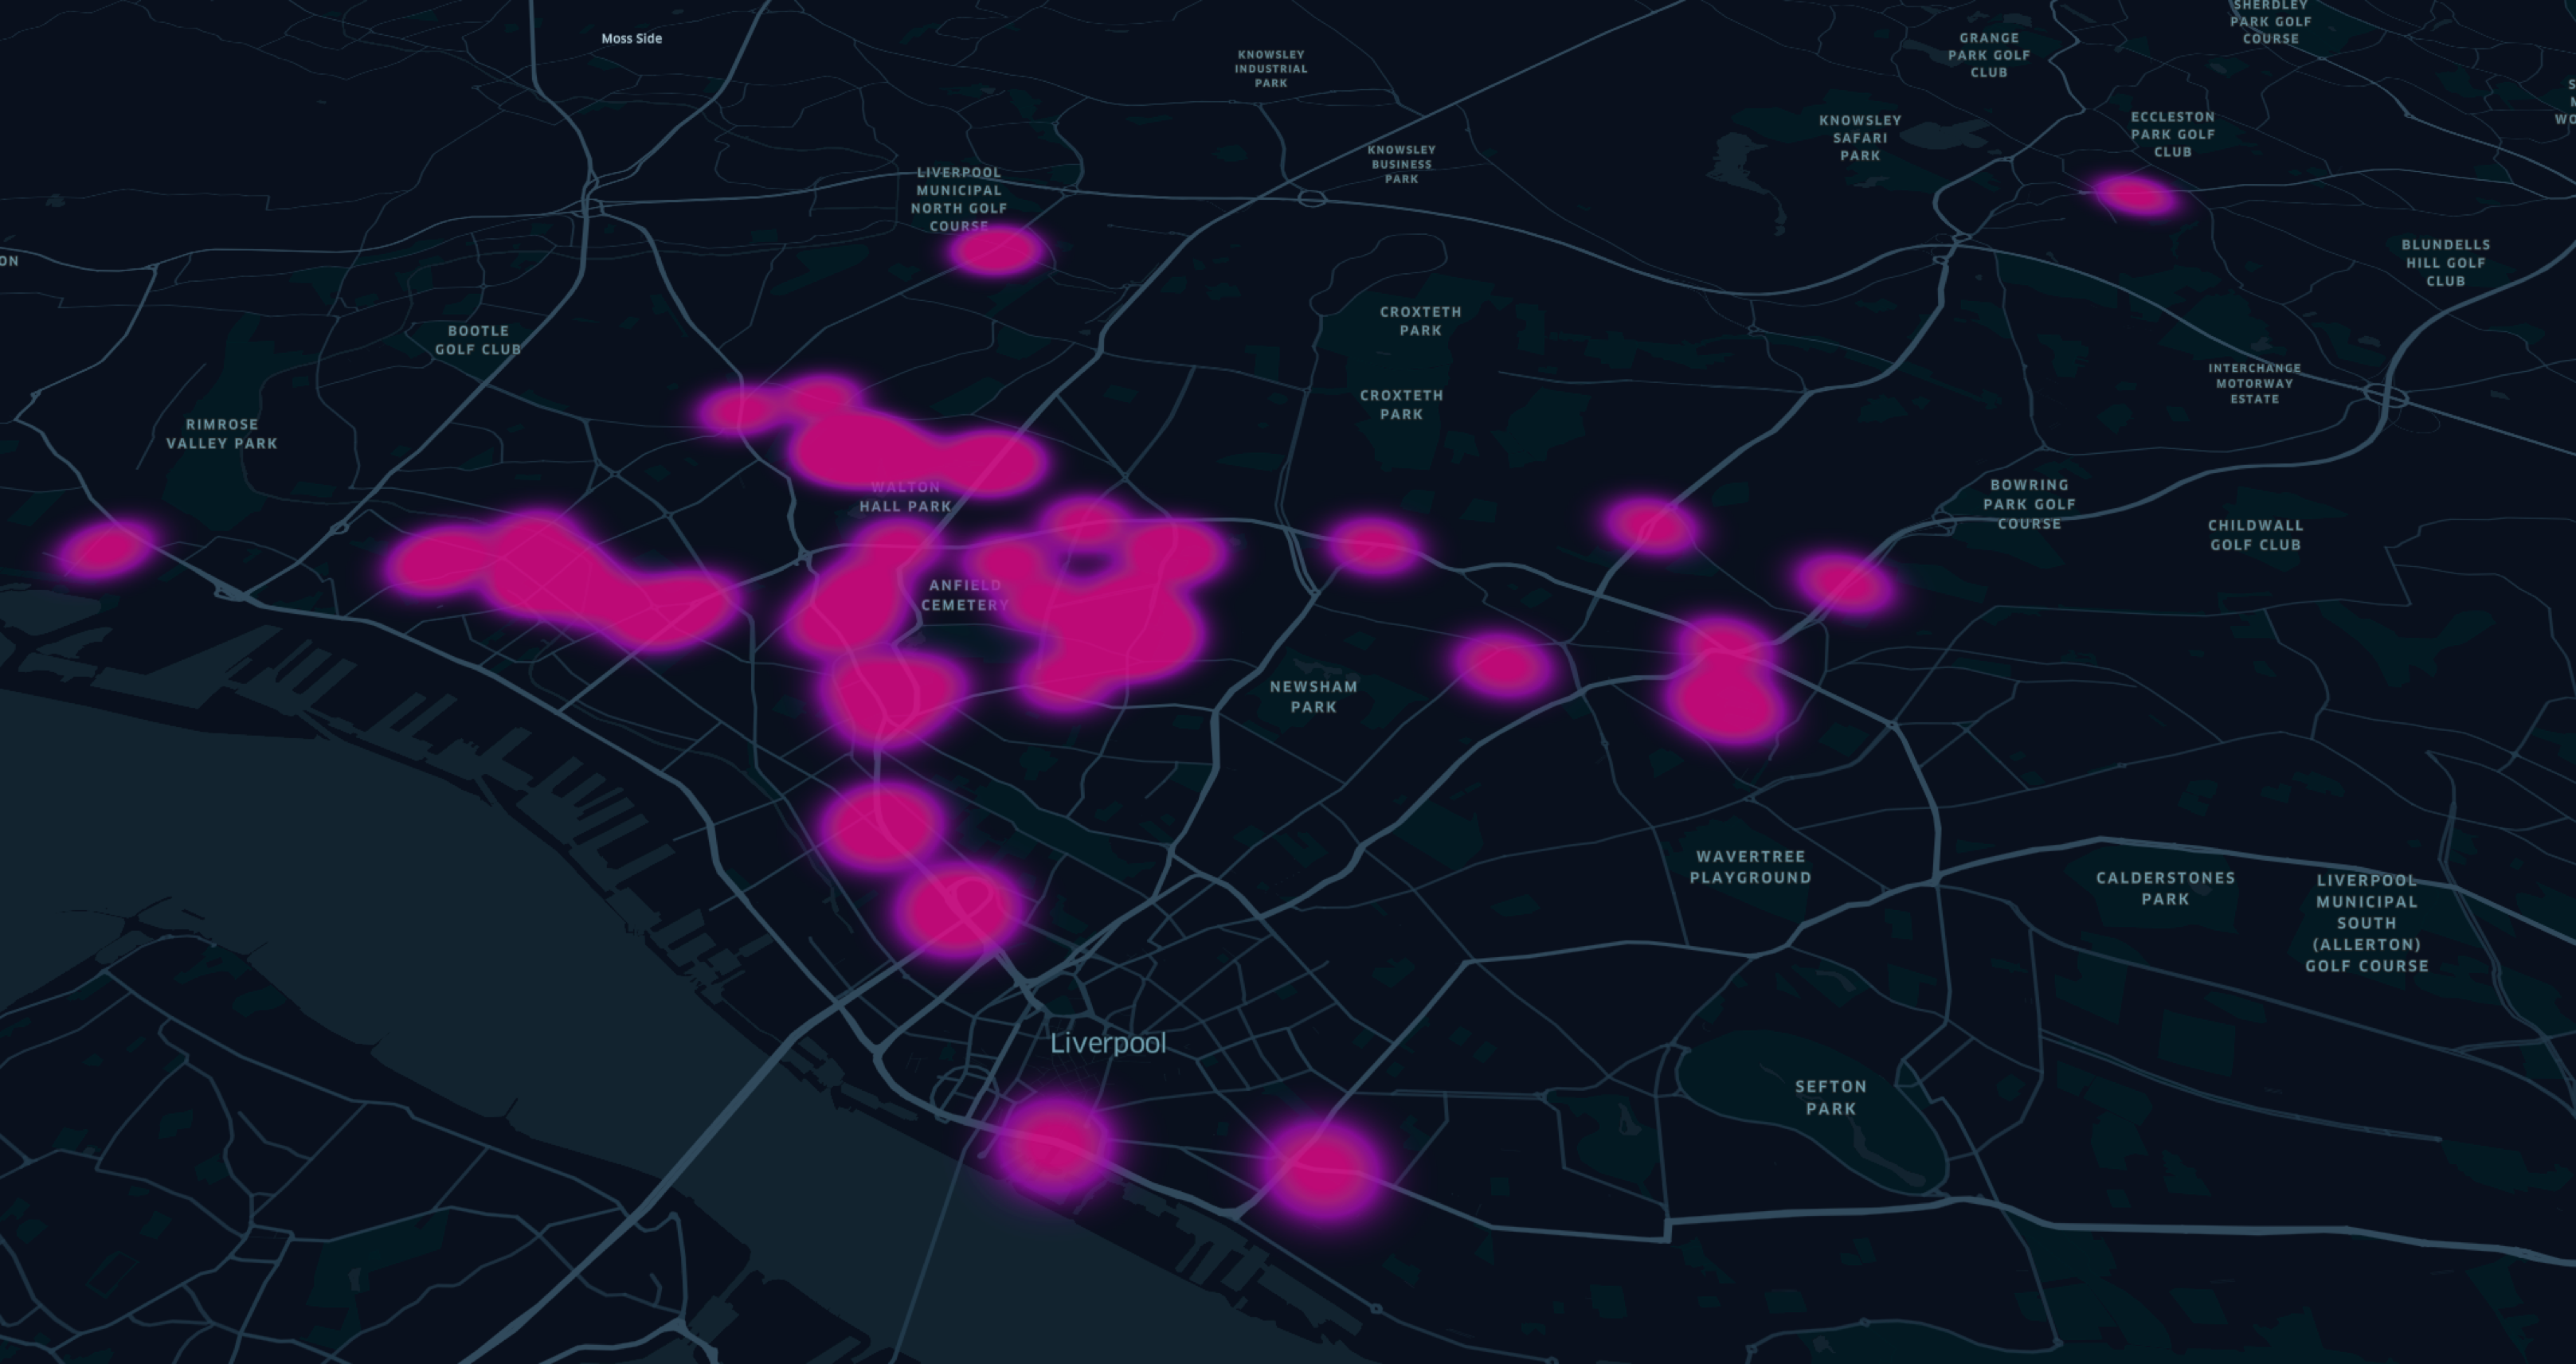
The crashes happened all around Anfield Stadium in Liverpool.
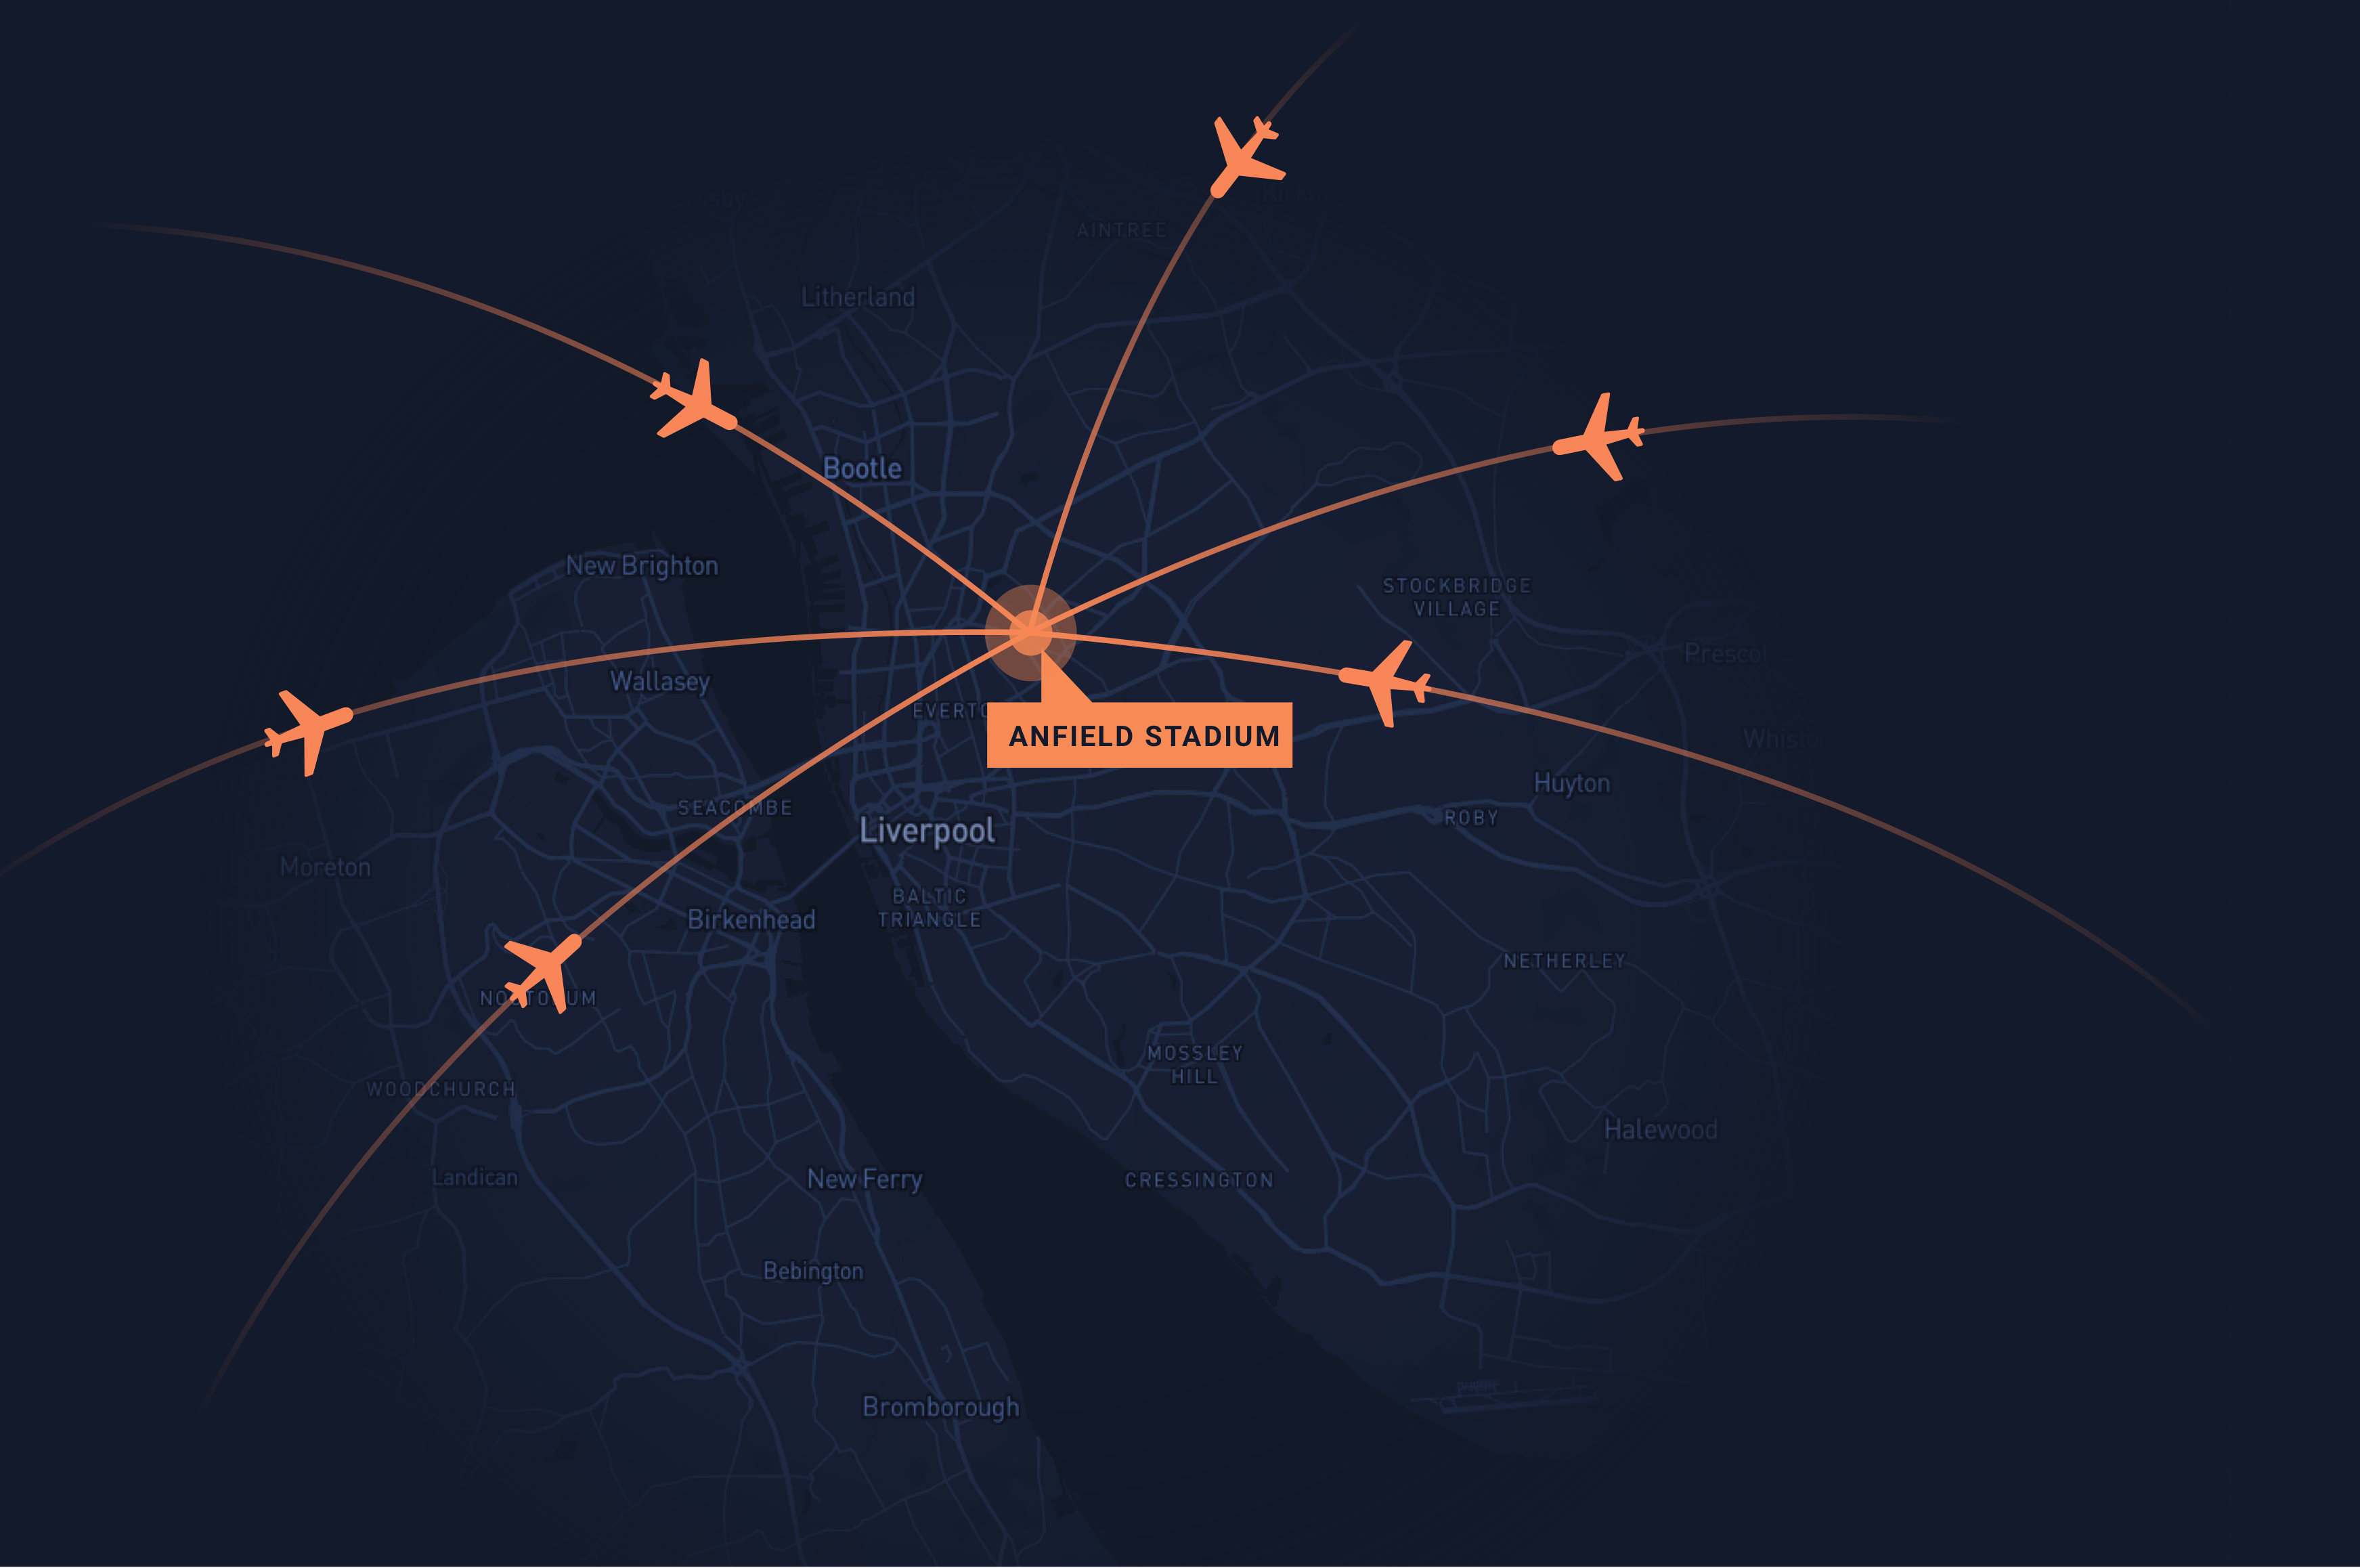
We did a Google search and discovered that on March 11 Liverpool played Atletico Madrid. At the time it was a high profile and controversial game being played at a time when Covid-19 was a big risk.

50,000 fans attended and many flew into Liverpool, indicating there may have been fans unfamiliar with the area.
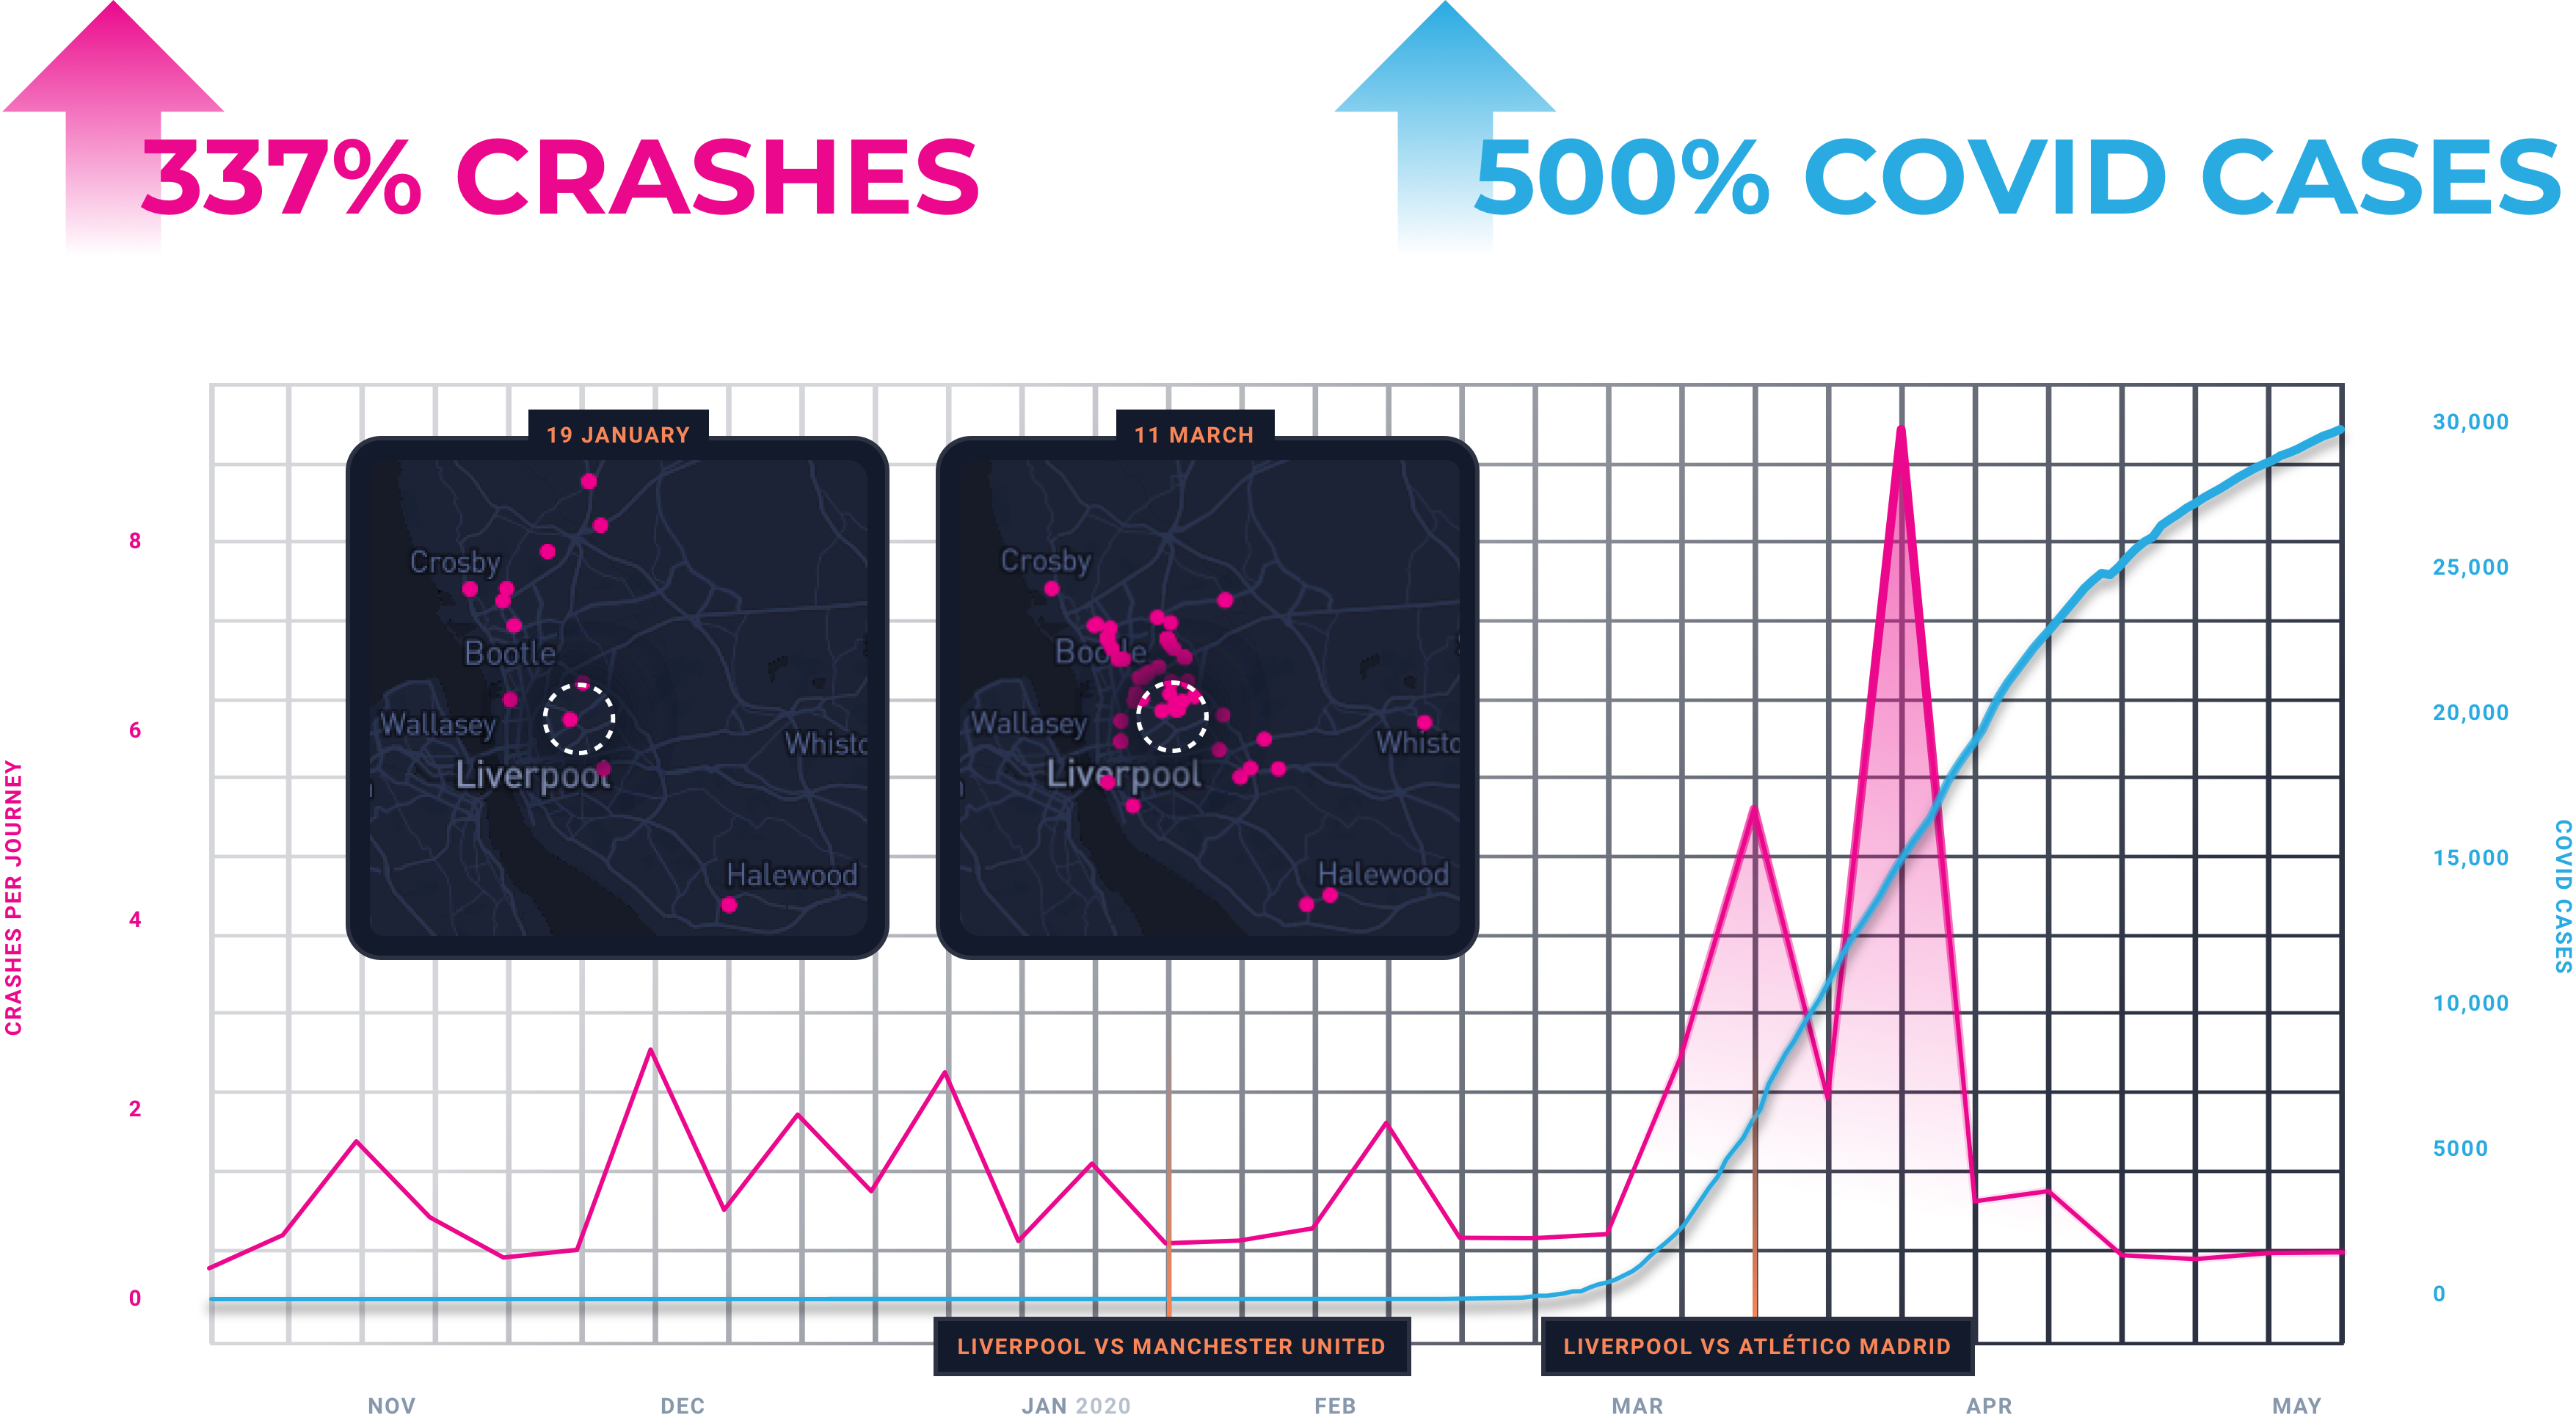
Our data shows a 337% increase in crashes while other reports show a 500% increase in Covid-19 cases right around the same time.
Is this normal? Could it just be that this is what happens when people attend big sporting events?
We compared games from January 19 when Liverpool played Manchester United to March 11 when Liverpool played Atletico Madrid. Many of the metrics are almost identical. In an area of 20km by 20km, we see 4,098 trips versus 4,075 trips, 428 drivers versus 390 drivers, and an average distance of 15.04 kilometers versus 14.78 kilometers.
But something interesting happened on March 11. We see a slight increase in hard breaks and hard accelerations we see a significant increase in speeding events. Now, look at the crashes. There’s a 337% increase on March 11.

What caused the change in driving behavior and crashes?
Behavior around Covid-19 is very contextual and our data shows how people drive in different cities at different times.
This data helps us ask the right questions to predict when there will be changes in driving behavior that result in more accidents.
Why was there an increase in risky driving and car accidents in Liverpool during the Atletico Madrid game and not in the Manchester United match?
Could it be that on March 11, many of the people in Liverpool were from Spain, renting and driving cars in an unfamiliar city? In comparison to the game on January 19 soccer game, maybe Liverpool was easier to navigate for people from Manchester and the surrounding areas than it was for people flying in from Spain on March 11. Or, perhaps the risky driving behavior was a result of heightened emotions and stress due to Covid-19 risk. The first documented case of Covid-19 in the UK was reported on February 28. Perhaps it’s a combination of all these reasons. We may not know clearly why there is an increase in risky driving behavior, but now we have the data that might help us forecast these situations.
ERA provides the data to help predict what’s going to happen so you can act on it. For example, a fleet company using ERA’s data can identify when it’s best to incentivize people to use public transportation or ride-sharing, such as Uber or Lyft, in efforts to protect their vehicles and customers. The same applies to insurance companies that may choose to implement flexible rates, meaning rates are higher on days risky driving is predicted. Like the fleet company, insurance companies may also incentivize drivers with a coupon to public transportation or ride-sharing services.
What would you do with this data? What strategies would you develop to better protect your assets and people to incur less risk and, very possibly, save lives?
We’re only at the early stages of this data revolution and the possibilities are endless. What is important to keep in mind is that data can be a real game-changer if you know how to use it to your advantage. Together with ALD Automotive, we aim to see how we can make the most of connected car data to meet the needs of fleets and drivers – now and in the future. Stay tuned for more!